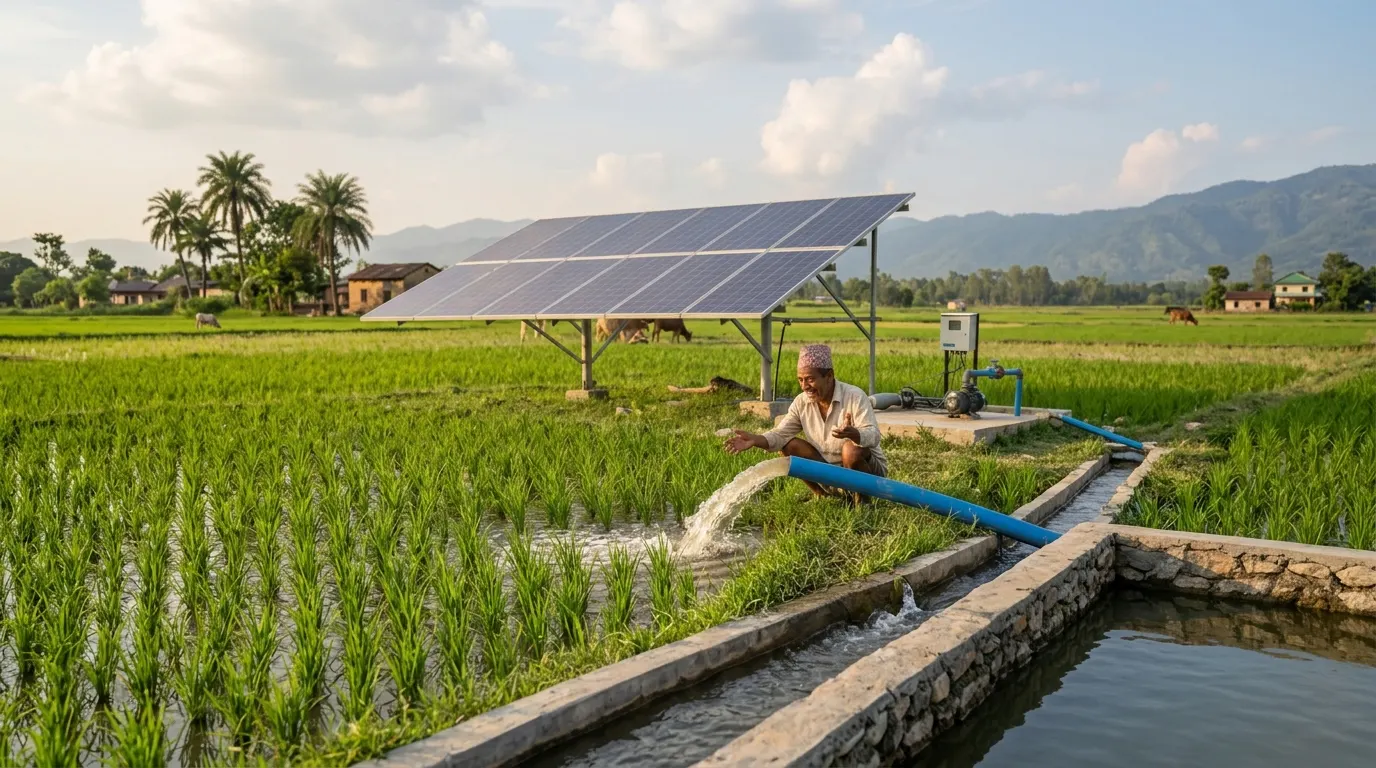
Most guides give you the equations and stop. That is the easy part. The hard part is knowing what to measure first, what to do when the spring cannot supply what the village is asking for, and which number in a supplier’s quotation is the one that will be wrong.
This guide follows one scheme from start to finish. Every step has the arithmetic written out. By the end you should be able to size a system yourself. There are costs for pumps, controllers and panels at the bottom, because that is usually the second question anyone asks.
If you want the broader picture first — subsidy routes, tariff structures, ownership models and common failure modes — that’s covered in Solar Water Pumping in Nepal: The Complete Guide. This post picks up where that one leaves off, on the arithmetic of sizing a specific scheme.
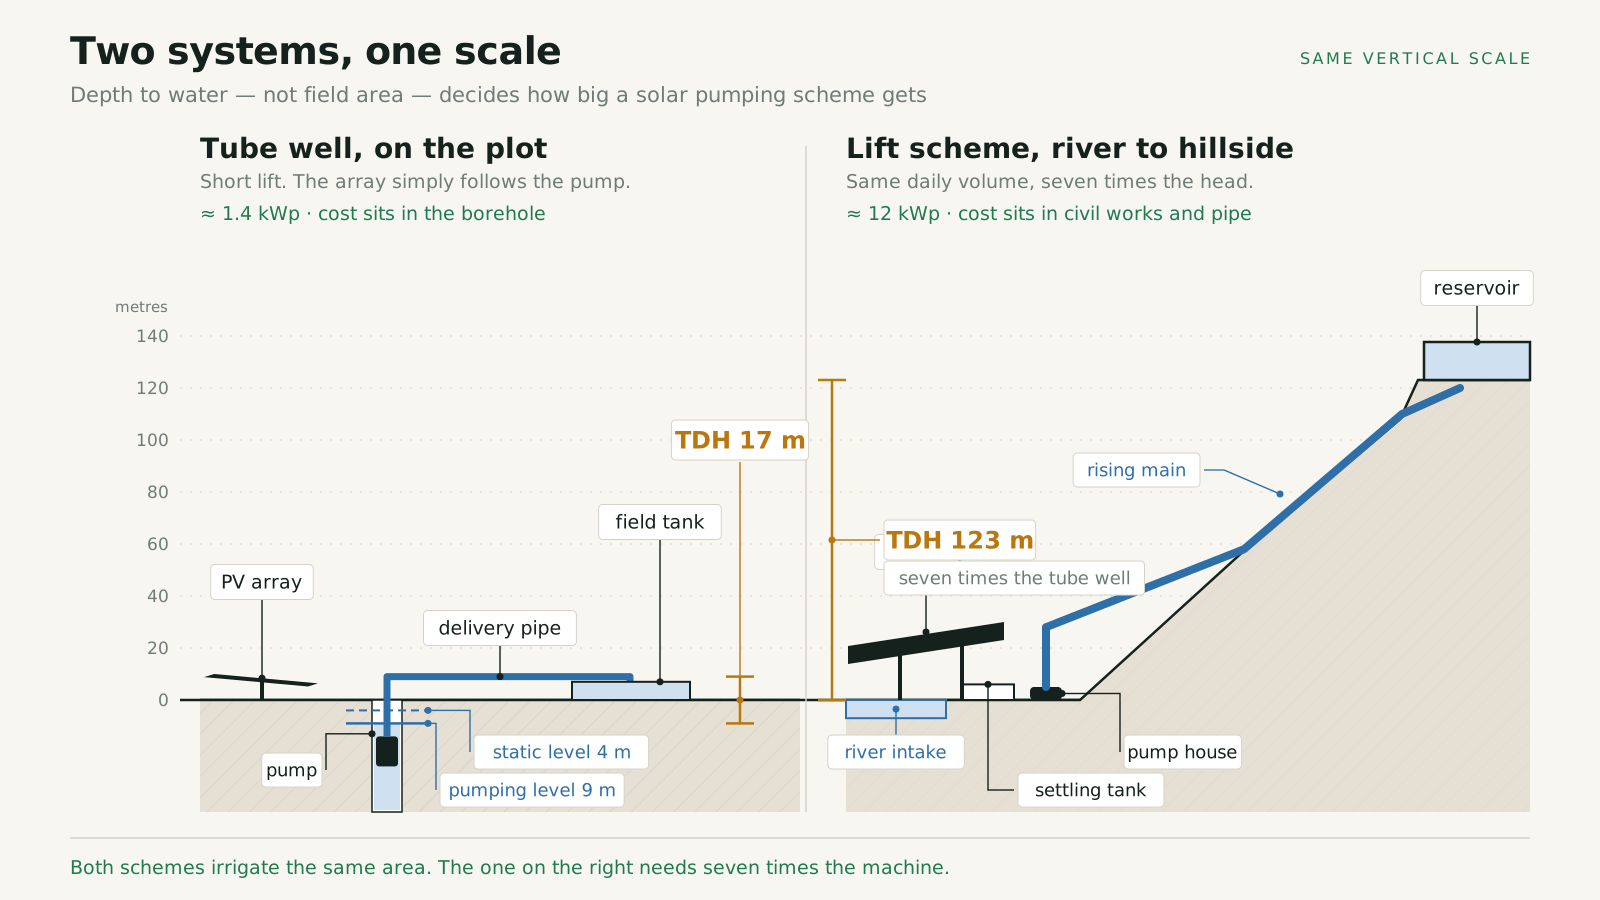
Both are solar water pumping systems, sized with the same arithmetic below, but a lift scheme’s longer pipe run and greater head make every step in that arithmetic matter more.
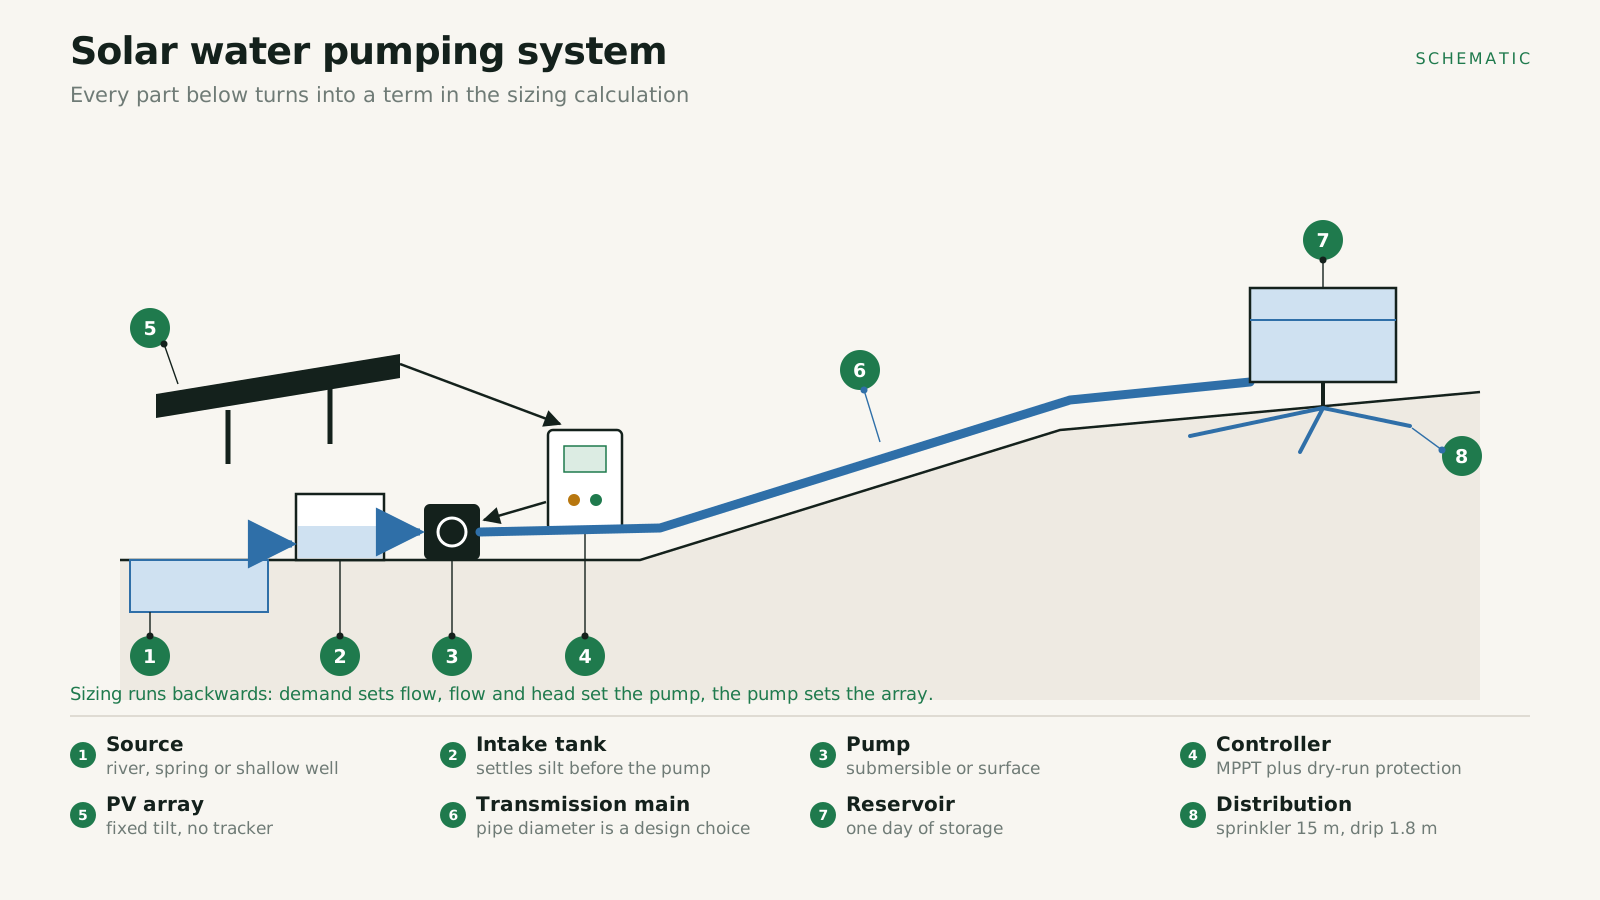
The order of calculation
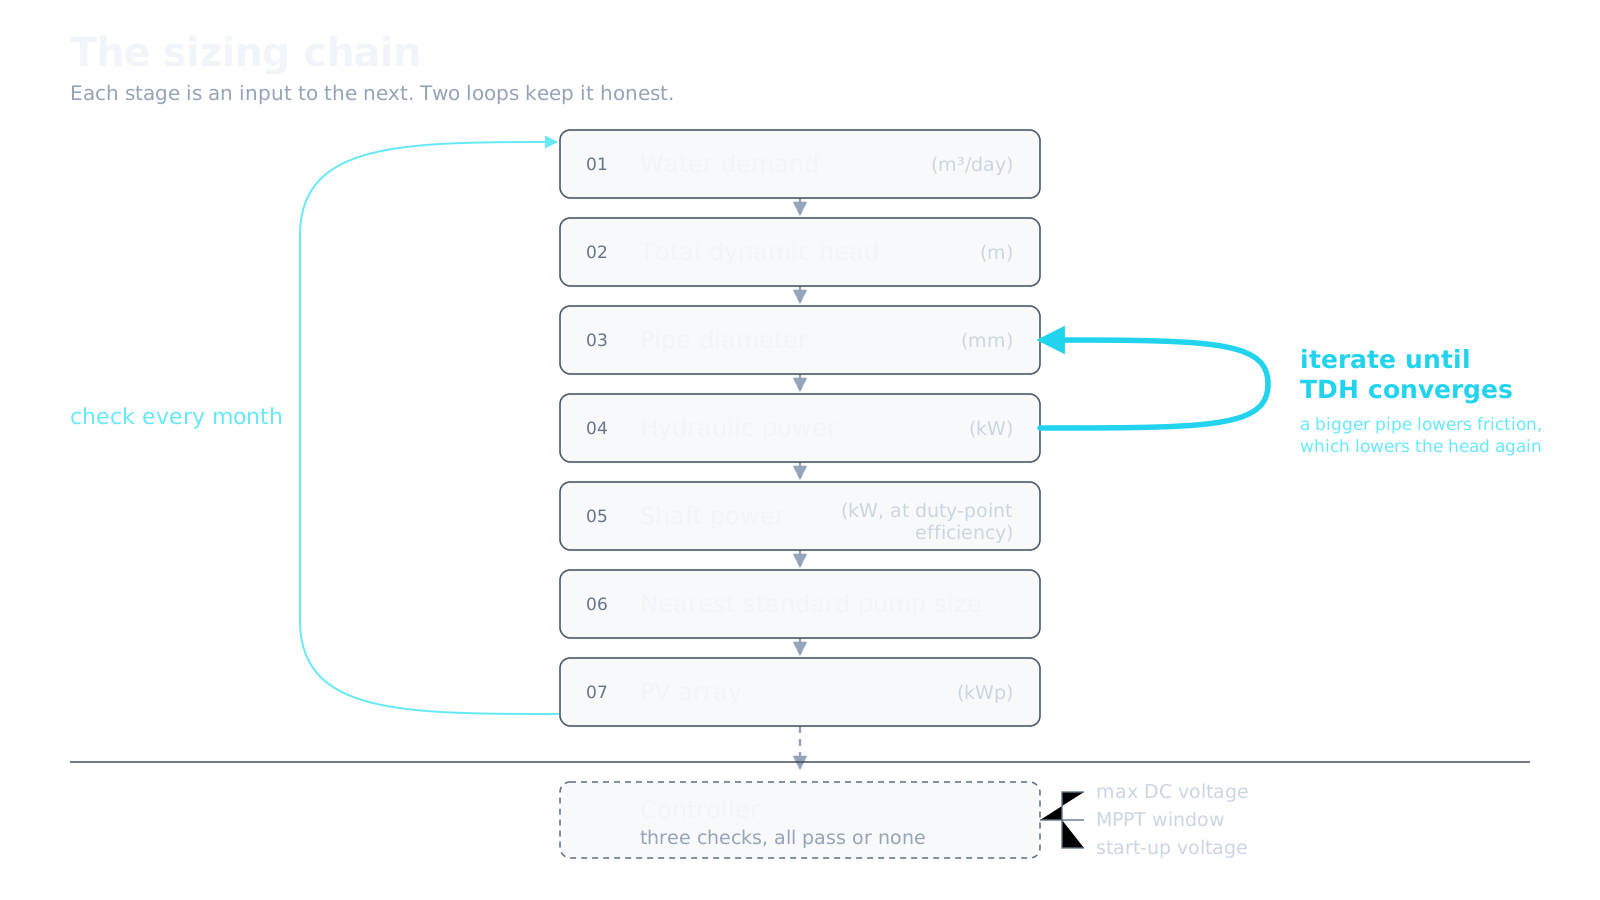
Do these in order. Each step feeds the next, and if you skip ahead you will end up redoing the work.
| Step | What you work out | What it depends on |
|---|---|---|
| 1 | Water needed per day | Crop and area, or people |
| 2 | Water the source can give | Field measurement, dry season |
| 3 | Schedule and command area | Steps 1 and 2 together |
| 4 | Daily pumped volume and design flow | Step 3 and peak sun hours |
| 5 | Total dynamic head | Site survey |
| 6 | Pipe diameter | Step 4 and 5, iterated |
| 7 | Pump power and model | Steps 4, 5 and 6 |
| 8 | Controller | Step 7 |
| 9 | Solar array size | Step 7 |
| 10 | String configuration | Steps 8 and 9 together |
| 11 | Cable sizes | Steps 7 to 10 |
| 12 | Storage tank | Steps 2 and 4 |
| 13 | Month by month check | Everything above |
Notice that the pump comes seventh, not first. People start there and it is why so many systems are wrong.
Step 1: Work out how much water you need
This is the foundation. Get it wrong and everything after it is wrong.
For irrigation
FAO’s irrigation manual gives a useful anchor. A continuous supply of 1 litre per second per hectare equals a daily requirement of 8.6 mm. Half that, 0.5 litres per second per hectare, equals 4.3 mm per day. FAO warns that this is a rule of thumb and that hot dry climates can need three times what humid climates need.
For Nepal specifically, CROPWAT studies of the Terai have found crop water requirements ranging from about 320 mm for potato up to about 1,010 mm for paddy, depending on crop and district. That is a wide spread, which is why a single national number does not exist.
If you have the cropping calendar and a spare day, run CROPWAT 8.0 with climate data from NASA POWER. It gives you a month by month requirement, which is far more useful than a season total.
If you do not, use a continuous design rate. For a year round vegetable rotation in the hills I use:
Net requirement                     0.45 l/s/ha
Plus 25% for distribution losses    ×  1.33
Design figure                       0.60 l/s/ha
That is 0.24 litres per second per acre if you are working in ropani and acres. It sits comfortably inside FAO’s range and it is the number I will use for the rest of this guide.
Convert it to a daily volume, because that is what you actually design against:
0.6 l/s/ha × 86,400 seconds ÷ 1,000 = 51.84 m³ per day per hectareQuick answers, if that is all you came for:
| Crop | Water per hectare per day |
|---|---|
| Year round vegetables | About 52 m³ |
| Paddy (90 cm over a 120 day base period) | About 75 m³ |
| Maize or wheat | About 30 to 35 m³ |
For a single dominant crop you can also work from the base period. Depth in centimetres over the base period gives the seasonal total.
| Crop | Water requirement (cm) | Base period (days) |
|---|---|---|
| Paddy | 90 | 120 |
| Sunflower | 90 | 100 |
| Maize | 50 | 130 |
| Potato | 50 | 150 |
| Pulses | 50 | 120 |
| Wheat | 45 | 130 |
| Mustard | 35 | 125 |
| Radish | 30 | 60 |
| Cabbage | 30 | 120 |
Source: Department of Irrigation handbook figures, as tabulated by Karki and Lohani (2020).
One warning. Size for the future cropping pattern, not today’s. Land currently under maize demands far less than the vegetables the project is meant to enable. Design for maize and you have built in the constraint you were trying to remove.
For drinking water
Use per capita consumption times population, then add growth and institutions.
Published work on Nepali community water supply puts per capita consumption at about 45 litres per person per day in rural areas and 60 litres in urban areas. Rural figures are lower partly because people are carrying water by hand and self-limit.
A worked example for a hill village:
Population today                    250 people
Growth over 20 year design life     × 1.5
Design population                   375 people
Per capita                          45 litres/day
Domestic demand                     16,875 litres/day
School (120 students × 5 l)         600 litres/day
Health post                         500 litres/day
Total                               17,975 litres  ≈  18 m³/day
Round up and design for 20 m³ per day.
Three things that cut the water you actually have to pump
Before you accept the demand figure, reduce it. Every cubic metre you do not have to pump makes the pump, the array and the whole system smaller and cheaper.
Nobody irrigates everything at once. Farmers water one plot at a time. If you divide the command area into zones and water one zone per day, the pump only has to serve that zone, not the whole scheme. A 6 hectare command area watered in three zones needs a pump sized for 2 hectares. That single decision can halve the capital cost.
The monsoon needs nothing. From Asar to Bhadra, rainfall covers the crop. Most hill schemes pump for five to seven months a year, not twelve. Do not size for a demand that only exists in Chaitra and then pay for it all year.
Use every other water source first. A spring that can reach part of the command area by gravity costs nothing to run. An existing canal, a weir on a nearby stream, a gravity flow line already under construction: subtract all of it from the demand before you size the pump. Pump only the water that nothing else can deliver.
Only after those three reductions do you have the real number.
Step 2: Measure what the source can give
Everything downstream is capped by this, and it is the figure most often taken on trust.
Springs and pipes: the bucket method. Channel the flow into a pipe, hold a bucket of known volume under it, and time the fill. Repeat five times and average. A 20 litre bucket filling in 27 seconds is 0.74 litres per second. Ten minutes of work.
Watch for the trap. Measure only what leaves the pipe and you miss water seeping around it. If the ground beside the outlet is wet, the real yield is higher and a proper collection structure will capture it. Note that in the report, but design on the measured figure.
Streams: the float method. Choose a straight, even reach. Measure the cross section at three points and average. Time a float over a known distance several times. Multiply average surface velocity by 0.85 to get mean velocity. Flow equals area times mean velocity.
Borewells: a pumping test. Record static water level. Pump at a steady rate, recording the level every few minutes until it settles. The difference is drawdown, and you cannot guess it. Then stop and record recovery, which tells you the recharge rate.
Measure in the dry season. A flow measured in Bhadra describes a different project from the same spring in Chaitra. Write the date beside the number.
For this guide: a spring measured at 0.75 litres per second in Chaitra.
0.75 l/s × 86,400 ÷ 1,000 = 64.8 m³ per dayStep 3: Match demand to supply and set the schedule
Now put the two numbers side by side. This step is missing from most reports and it is where designs quietly go wrong.
Say the community wants 2 hectares of vegetables irrigated.
Demand    2.0 ha × 51.84  =  103.7 m³/day
Source                    =   64.8 m³/day
The source covers 62 per cent of the ask. Dividing the other way, 64.8 ÷ 51.84 shows the source supports 1.25 hectares at full requirement, not two.
You have three honest options. Pick one openly.
Option A: irrigate less land, properly. Serve 1.25 hectares. Unpopular in a village meeting, usually correct.
Option B: rotate zones and accept a deficit. Split the area into zones and water one per day.
| Three zones of 0.67 ha | Value |
|---|---|
| Full requirement per zone | 34.6 m³/day |
| Delivered, 60 m³ every third day | 20.0 m³/day average |
| Share of full requirement | 58% |
Understand what rotation does. It redistributes water across days. It does not create any. Every zone still gets 58 per cent of what it wants. Whether the crop survives depends on soil water holding capacity and application method, and it works far better with drip than with flooding. Write the deficit into the report. An unacknowledged shortfall becomes a complaint in year two.
Option C: add a supplementary source. A weir on a nearby stream used only in dry months is often the cheapest fix, and it removes the single point of failure of relying on one spring.
For this guide the community chose rotation across three zones.
Step 4: Set the daily volume and design flow
Two decisions.
Daily pumped volume. Take the source yield and leave a margin. Source gives 64.8 m³ per day, so design for 60 m³ per day.
Peak sun hours. This is how many hours of full-strength sun you can count on. The annual average for Nepal is about 4.6 hours. That is an average. A system that must work in Poush needs the worst month, so for off grid pumping I design to 4 hours.
Design flow = 60 m³/day ÷ 4 hours = 15 m³/hrThat is the flow the pump must deliver. Everything about the pump follows from it.
Step 5: Survey the head and build the TDH
Google Earth gave you an estimate. Now measure.
The Abney level method. Walk the pipe route from intake to the highest delivery point in segments. For each segment record the slope length and the angle. The rise is slope length times the sine of the angle. Tabulate and sum.
| Segment | Slope length (m) | Angle (deg) | Rise (m) | Cumulative rise (m) |
|---|---|---|---|---|
| 1 | 30.0 | 7.0 | 3.66 | 3.66 |
| 2 | 30.0 | 11.0 | 5.72 | 9.38 |
| 3 | 25.0 | 15.0 | 6.47 | 15.85 |
| … | … | … | … | … |
| Last | 20.0 | 5.0 | 1.74 | ~100 |
Keep segments short where the ground changes and up to 30 metres where it is even. Put the whole table in an annex. Someone will want to check it, and you will want it when the head is disputed two years later.
For this guide the survey gives about 100 metres of vertical rise over 615 metres of ground length.
Add 10 per cent to the pipe length. Pipe follows small dips a survey does not capture. 615 metres becomes 676 metres.
Split the material by pressure. The lowest point carries the highest static pressure, so put the stronger material there. A common convention is galvanised iron for the first 15 per cent and HDPE for the rest. Here, 101 metres of GI and 575 metres of HDPE.
Now add up the total dynamic head:
| Component | Value |
|---|---|
| Vertical rise, from the survey | 100.0 m |
| Water depth in the intake | 3.0 m |
| Height of the distribution tank | 2.0 m |
| Friction loss in the pipe | 10.6 m |
| Minor losses through fittings | 6.8 m |
| Sum | 122.4 m |
| Design TDH | 125 m |
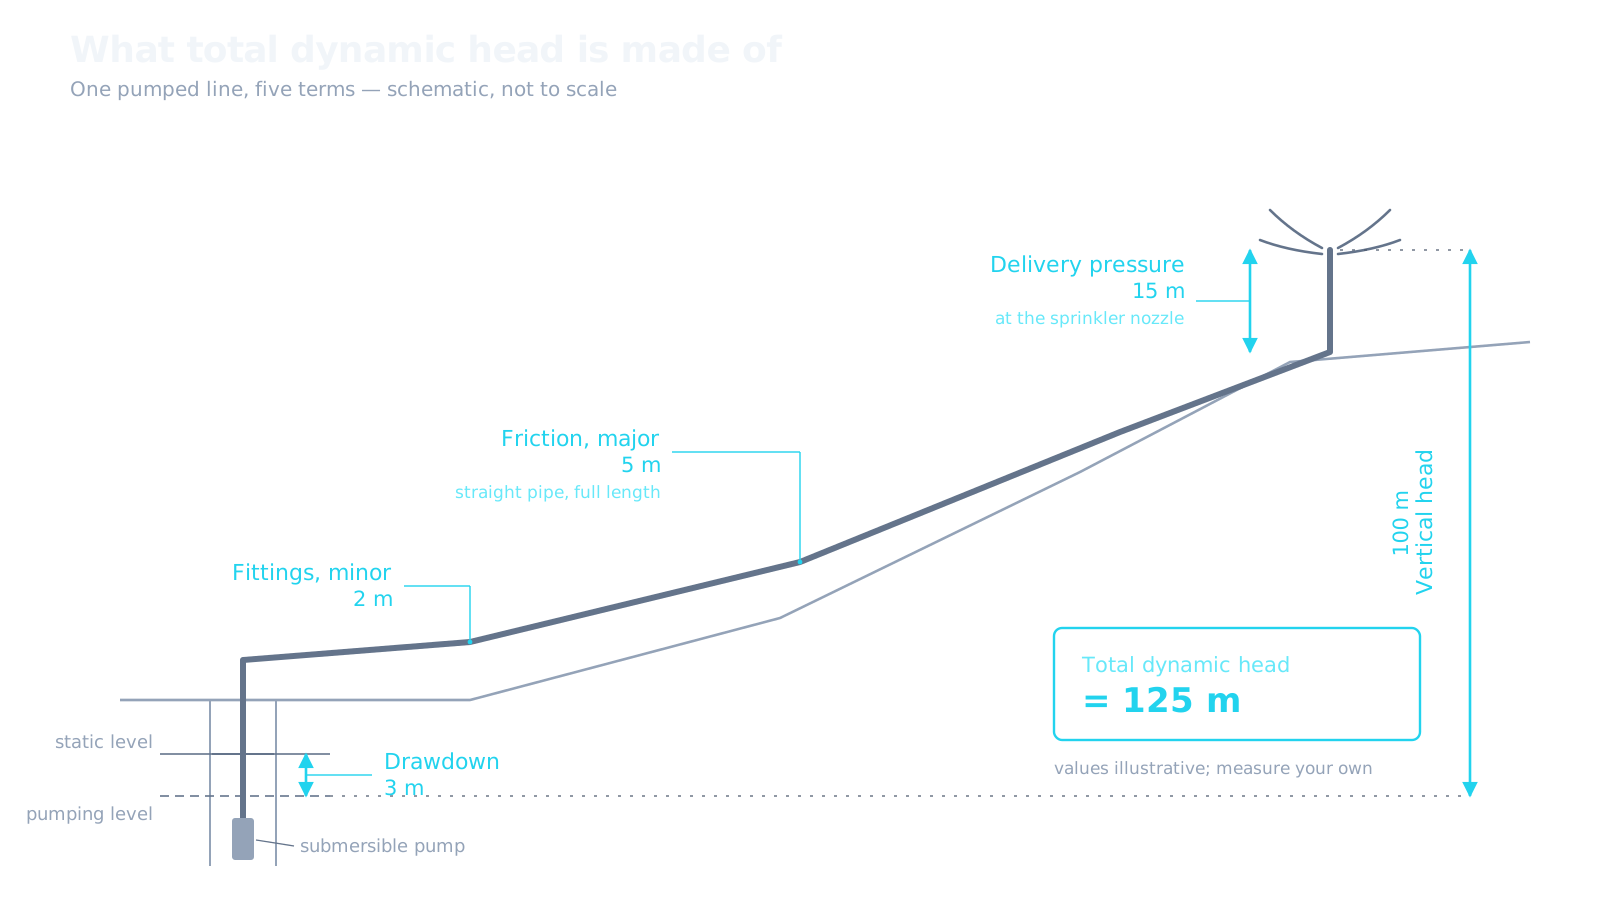
Two shortcuts. For a first pass, take minor losses as about 1 per cent of the pipe length, then refine when the civil drawings show the actual fittings. And if the scheme feeds sprinklers, add about 15 metres of pressure at the nozzle. Drip needs about 1.8 metres. Forgetting delivery pressure is one of the most common errors in Nepali designs.
If you want the exact fitting losses, each fitting has a coefficient: a swing check valve is 2, a water meter is 7, a fully open gate valve is 0.15, and a fully open globe valve is 10. That last number is why nobody puts a globe valve in a transmission main.
Step 6: Choose the pipe size
This is where a design beats an assembly. The instinct is to match the pipe to the pump outlet. Do that and friction eats the head you paid for.
Use a calculator rather than working Darcy Weisbach by hand. The pipe friction loss calculator on this site uses the Hazen Williams equation and covers HDPE, GI, PVC and several other materials. National Pump’s HDPE friction calculator is another option built specifically for metric HDPE, which matters because HDPE is sized on outside diameter and the wall thickness changes with pressure class, so remember to enter the internal diameter either way.
Iterate: assume a loss, size the pump, calculate the real loss, repeat.
| Pipe (HDPE PN16) | Friction loss | Resulting TDH |
|---|---|---|
| 63 mm | 33.7 m | 159 m |
| 75 mm | 15.9 m | 141 m |
| 90 mm | 6.2 m | 131 m |
Two sizes up removes 27 metres of head. Pipe is cheap. Pumps and panels are not. Going one size up on the pipe is almost always cheaper than going one size up on the pump, and the saving compounds because the array shrinks too.
Check the pressure class as well as the diameter. PN16 holds 160 metres of water column. If your static head is 120 metres you have margin. If it is 155, you do not, and surge when the pump stops will find that out for you.
Step 7: Calculate the pump
Hydraulic power is the useful work of lifting water:
P_H = (ρ × g × q × h) ÷ (3.6 × 10⁶)

    = (1,000 × 9.81 × 15 × 125) ÷ 3,600,000
    = 5.11 kW
Shaft power divides by the efficiency of the pump at the point where you are running it:
P_S = 5.11 ÷ 0.63 = 8.11 kW → nearest standard size, 11 kW (15 HP)Efficiency is where careful designs come apart. Use the efficiency where your flow and head actually meet on the pump curve, not the peak of the curve. A pump quoted at 69 per cent peak may sit at 50 per cent at your duty point. Across three phase submersibles sold in Nepal, duty point efficiency runs roughly 58 to 70 per cent. Where you cannot get the figure, use 60 to 63 per cent.
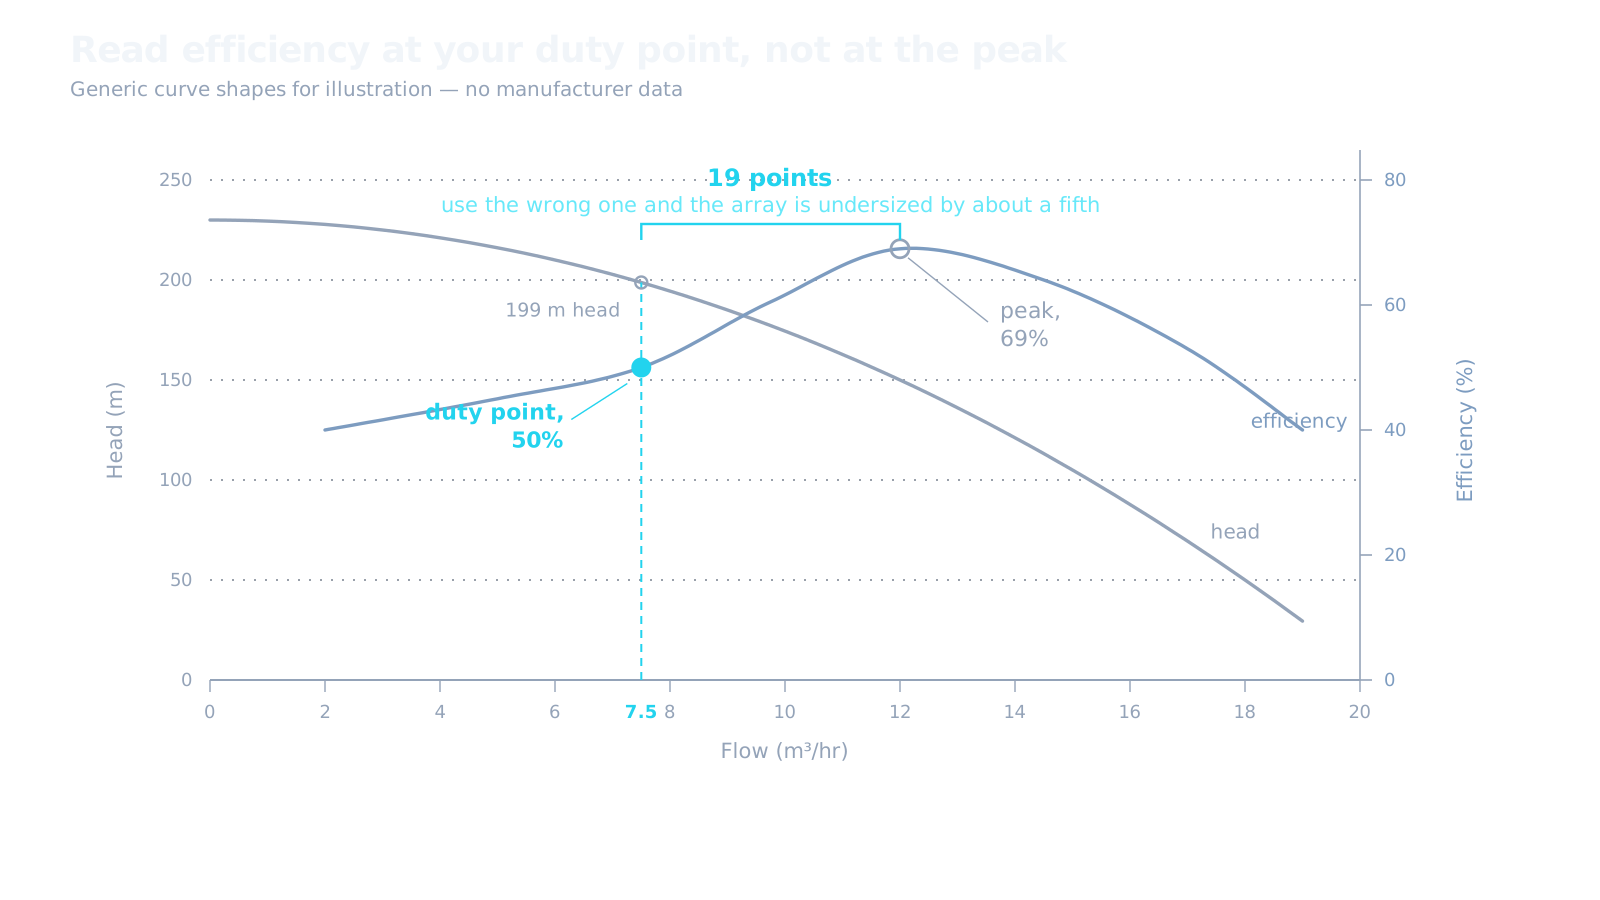
Use a selector tool. Pedrollo’s Spring of Data selector lets you enter flow and head and returns models that meet the duty, with efficiency at that point. Enter 15 m³/hr against 125 m and it narrows you to two or three candidates in the 15 HP class. Do the same on a second brand. Pedrollo, Kirloskar, Grundfos, Shakti and Crompton are all available here, and their efficiency at the same duty differs more than people expect.
Pumps only come in standard sizes: 1.1, 1.5, 2.2, 3, 4, 5.5, 7.5, 11, 15 and 22 kW. Round up.
What a solar pump costs in Nepal
Indicative prices for three phase AC submersible pumps, mid-2026, including VAT. Treat these as a band for budgeting, not a quotation.
| Pump size | Indicative price |
|---|---|
| 5.5 kW (7.5 HP) | NPR 2.4 to 3.3 lakh |
| 7.5 kW (10 HP) | NPR 3.6 to 4.8 lakh |
| 11 kW (15 HP) | NPR 4.4 to 6.0 lakh |
| 15 kW (20 HP) | NPR 4.5 to 6.1 lakh |
| 22 kW (30 HP) | NPR 7.1 to 9.7 lakh |
Look at 15 HP and 20 HP. They cost nearly the same. The jump from 20 HP to 30 HP is around 60 per cent. If your calculation lands near the top of a band, the next size up may cost almost nothing and buy you real margin. Check actual quotations before you optimise the calculation to death.
Step 8: Choose the controller
The solar pump controller, sometimes called a VFD or drive, converts DC from the panels into AC for the pump and tracks the maximum power point. Match its rating to the pump: an 11 kW pump takes an 11 kW controller.
| Controller rating | Indicative price |
|---|---|
| 5.5 kW | NPR 81,000 to 109,000 |
| 11 kW | NPR 119,000 to 161,000 |
| 15 kW | NPR 136,000 to 184,000 |
| 22 kW | NPR 212,000 to 288,000 |
Add a dV/dt filter, roughly NPR 26,000 to 34,000, wherever the cable from controller to pump is longer than about 150 metres. Without it, voltage spikes off the drive degrade the motor winding over time.
On starting current: an induction motor given full voltage at start draws two to three times its rated current. Solar pump controllers have a soft start that ramps the voltage instead. Where soft start is absent, overrate the controller by 20 to 25 per cent.
Step 9: Size the solar array
Two routes. They should agree.
The quick route. Multiply pump rating by 1.3.
11 kW × 1.3 = 14.3 kWpThe loss stack. Divide pump rating by the product of all the losses.
| Loss | Factor |
|---|---|
| DC wiring, 3 per cent limit | 0.97 |
| AC wiring, 1 per cent limit | 0.99 |
| Shading at a clean site | 0.90 |
| Soiling | 0.98 |
| Controller | 0.98 |
| Temperature above 25 °C | 0.975 |
| Combined | 0.81 |
11 ÷ 0.81 = 13.6 kWpBoth land in the same place. Real off grid schemes in Nepal come out at 1.3 to 1.4 kWp per kW of pump rating, which is a third check on the same answer.
Now verify the daily energy, because the power check alone can mislead:
Hydraulic energy   1,000 × 9.81 × 60 × 125 ÷ 3.6×10⁶  =  20.4 kWh/day
Electrical to pump at 63%                              =  32.4 kWh/day
DC after controller at 95%                             =  34.1 kWh/day
Array output, 14.3 kWp × 4 PSH × 0.8 derate            =  45.8 kWh/day
Comfortable. If the last line had come out below the one above it, the array is too small no matter what the 1.3 rule said.
How much land does the array need?
A common question and easy to answer.
| Measure | Area per kWp |
|---|---|
| Module surface only | About 5 m² |
| Ground mount on flat land, with row spacing | 10 to 12 m² |
| Ground mount on hill terraces, split across levels | 15 to 20 m² |
| Add fencing clearance | 1 to 2 m all round |
For the 14.3 kWp array in this example, expect to need roughly 200 to 280 m² of terraced hill land, or about 150 m² on flat ground. If the plot you’re working with is quoted in Ropani, Aana or another local unit rather than square metres, the Nepal land area converter converts it in one step.
What the solar PV costs
Solar modules in Nepal currently run roughly NPR 20 to 30 per watt-peak for the panels themselves. A complete installed array, adding mounting structure, cabling, protection and installation labour, comes to roughly NPR 40 to 60 per watt-peak for small systems under 20 kWp. Small systems carry the same fixed costs as large ones, so cost per watt falls as size rises.
For the 14.3 kWp array here, budget somewhere around NPR 6 to 8.5 lakh installed.
Step 10: Configure the strings and check the controller
Three checks. Do all three before ordering anything, because this is how people end up with equipment that cannot be connected.
Take a 580 Wp module with Voc 51.5 V and Vmp 43.2 V, and a controller with maximum DC input 800 V, MPPT window 300 to 750 V, and start up voltage 300 V.
Check 1: maximum voltage on the coldest morning. Open circuit voltage rises as temperature falls, so the binding case is a clear winter dawn, not a summer afternoon.
Voc at −5 °C = 51.5 × (1 + 0.0025 × 30) = 55.4 V

12 modules in series = 664 V  against an 800 V limit.  Passes.
14 modules in series = 775 V.  Passes, but only 25 V of margin.  Too tight.
Check 2: operating voltage on the hottest afternoon. Vmp falls as cells heat up.
Vmp at 45 °C = 43.2 × (1 − 0.0035 × 20) = 40.2 V

12 modules in series = 482 V, inside the 300 to 750 V window.  Passes.
Aim for the upper middle of the MPPT window. At 482 V there is 182 V of headroom before the array drops out of the window, and that headroom is what keeps the pump running through cloud and early morning.
Check 3: start up voltage. This ranges from about 200 to 300 V across units sold here. It decides whether pumping starts at nine or at eleven on a hazy Magh morning. Ask for the number.
Final configuration: 12 modules in series, 2 strings, 24 modules, 13.9 kWp.
Step 11: Size the cables
Use a calculator. The voltage drop calculator on this site handles both DC and AC, returns the loss in volts, percent and watts, and suggests the smallest standard cable size that meets your target. This external tool is another option that works the same way.
Design DC runs to a 3 per cent drop and the AC run to the pump to 1 per cent. On a hill scheme the controller to pump cable can be 200 metres, and that run usually drives the cable budget. Bury the armoured AC cable at least 0.4 metres where people and vehicles pass.
Step 12: Size the storage tank
A slow spring and a fast pump need a buffer between them. The tank is that buffer, and the way to size it is to walk through a day.
Our spring gives 0.75 litres per second, which is 2.7 m³ per hour, running continuously, day and night. Our pump takes 15 m³ per hour but only for the four hours of good sun, say 10:00 to 14:00.
Picture the tank on a normal day, starting full at 60 m³:
| Time | What happens | Tank level |
|---|---|---|
| 10:00 | Pump starts | 60.0 m³ |
| 11:00 | Out 15, in 2.7 | 47.7 m³ |
| 12:00 | Out 15, in 2.7 | 35.4 m³ |
| 13:00 | Out 15, in 2.7 | 23.1 m³ |
| 14:00 | Pump stops | 10.8 m³ |
| 14:00 to 08:00 | Spring refills at 2.7 m³/hr for 18 hours | Back to full |
The tank never empties. It bottoms out at 10.8 m³, which keeps water above the pump inlet, and the spring refills it overnight ready for the next day.
Now try a 40 m³ tank instead. The pump removes 60 m³ and the spring puts back 10.8 during those four hours, a net draw of 49.2 m³. Starting from 40 you run out before 14:00, the pump sucks air and burns out. A 40 m³ tank is too small for this scheme and a 60 m³ tank is right.
That is the whole method: net draw during the pumping window, plus enough left in the bottom to keep the pump submerged. Run the same balance over a full seven day cycle using dry season flow, because a single day can hide a slow drift. And fit a float switch for dry run protection whatever the arithmetic says.
Step 13: Check every month
Sizing gives you one number. Verify it across twelve.
Multiply each month’s peak sun hours by the pump output and plot it against that month’s demand. You will find a shortfall in two or three winter months. Then decide, deliberately, whether to go up a pump size or accept it.
A 15 per cent December shortfall on a drinking water scheme means 38 litres per person instead of 45, which people can live with. A 15 per cent Chaitra shortfall on an irrigation scheme is the project failing at the one moment it mattered. Write the decision into the report either way.
What the whole system costs
Pulling the example together. Electromechanical only, excluding civil works.
| Item | Indicative cost |
|---|---|
| Solar array, 13.9 kWp installed | NPR 6.0 to 8.5 lakh |
| Pump, 11 kW (15 HP) submersible | NPR 4.4 to 6.0 lakh |
| Controller, 11 kW | NPR 1.2 to 1.6 lakh |
| dV/dt filter | NPR 0.3 lakh |
| Cables, protection, earthing, lightning | NPR 1.5 to 2.5 lakh |
| Electromechanical total | NPR 13.4 to 18.9 lakh |
Civil works are separate and, in a hill lift scheme with two reinforced concrete reservoirs, an intake, pipe supports and several hundred metres of trenching, they often cost more than the electromechanical package. Budget for that early. Falling panel prices barely move the total on a scheme like this.
Rules of thumb
For quick estimates and for checking somebody else’s numbers.
| Question | Rule |
|---|---|
| Pump size in kW | 0.0045 × flow (m³/hr) × head (m) |
| Array size in kWp | 1.3 × pump rating in kW |
| Daily volume from design flow | Flow × 4 peak sun hours |
| Water for 1 ha of vegetables | About 52 m³/day |
| Water for 1 ha of paddy | About 75 m³/day |
| Water per person, rural | 45 litres/day |
| Land for the array | 10 to 12 m² per kWp flat, 15 to 20 on terraces |
| Peak sun hours for design | 4 hours off grid, 4.6 annual average |
| Suction limit of a surface pump | About 6 metres, whatever the catalogue says |
Check the pump rule against our example: 0.0045 × 15 × 125 = 8.4 kW, against 8.11 from the full calculation. Close enough for a first estimate, not close enough for a purchase order.
The tools
| Tool | Use it for | Cost |
|---|---|---|
| Google Earth Pro | Command area, pipe route, first elevation profile | Free |
| Global Solar Atlas or SolarGIS | Monthly irradiation and peak sun hours | Free tier |
| CROPWAT 8.0 with NASA POWER | Month by month crop water requirement | Free |
| AEPC and GIZ Planning Tool, Solar Water Pumping | First estimate of component sizes and cost | Free |
| Pipe friction loss calculator | Head loss and pressure drop by pipe material | Free |
| National Pump friction calculator | HDPE friction loss during pipe iteration | Free |
| Pedrollo Spring of Data selector | Pump selection with duty point efficiency | Free |
| Voltage drop calculator | DC and AC cable sizing | Free |
| Meteonorm | Temperature and rainfall graphs for the report | Paid |
| PVsyst | Detailed yield simulation and near shading scenes | Paid |
| AutoCAD | Intake, tank and structure drawings, single line diagram | Paid |
| EdrawMax or draw.io | Schematics and system diagrams for reports | Free tier |
| HOMER Pro | Comparing solar against grid against diesel | Paid |
A note on HOMER. It is a good tool and the wrong one for a straightforward solar pump. Use it when you are genuinely comparing generation options or sizing a hybrid, not to size a pump you could size in a spreadsheet.
The part that is not engineering
Technically sound schemes fail on this more often than on hydraulics.
Get land consent in writing before you design. Verbal agreement at a meeting is worth nothing when the array footprint crosses a boundary. You need written consent with the plot number for the array, the intake, both reservoirs and the pipe route. The pipe route usually crosses several private holdings and each needs its own consent.
Ask who else uses this water, upstream and downstream, for irrigation, drinking or religious use. Communities have refused abstraction from a river for reasons that had nothing to do with volume. Find that out during the survey.
Check whether the source is registered. An unregistered source invites a claim from a neighbouring village later.
Confirm the water user group exists, not that it is planned. A registered group with an operator, a tariff and a bank account is the difference between a scheme running for fifteen years and one that stops when the first pump fails.
Price the tariff to cover more than operation. An operator’s salary and routine maintenance is the easy part. Most community tariffs stop there and build no fund for pump replacement, which arrives around year ten. Price it in from the start.
What to read next
Everything below is free.
- AEPC and GIZ, Implementation process guideline: Solar water pumps. The complete package: demand forms, DFS survey forms and report templates, due diligence checklists, procurement agreements, construction and installation checklists, testing and commissioning formats, handover certificates. Separate templates for irrigation and drinking water. Available in English and Nepali from the AEPC solar water pumping page.
- AEPC and GIZ, Planning Tool: Solar Water Pumping. Excel tool for a first estimate of component sizes and system cost.
- ICIMOD, Technical handbook on solar water pumps (2023). Detailed treatment of components, head, pump sizing, life cycle cost, installation and maintenance, with survey templates and a Moody diagram in the annexes.
- IWMI, Training manual on solar irrigation pumps (2023). Bilingual English and Nepali, and the source of the 4.6 peak sun hour figure for Nepal.
- FAO Irrigation Water Management training manuals. Where the litres per second per hectare rules of thumb come from.
If a supplier’s documentation is thinner than the AEPC template, that is telling you something.
Where sizing goes wrong
- The source was measured in the wrong season. A spring measured in Bhadra is a different project from the same spring in Chaitra.
- Demand and source were never reconciled, so the report quietly designs for a command area the source cannot sustain.
- Peak efficiency was used instead of duty point efficiency, undersizing the array by a fifth from the first line of the spreadsheet.
- Nobody iterated the pipe. The main matched the pump outlet because that was easiest in the design office, not in the pipe.
- Sprinkler delivery pressure was left out of the head calculation.
- Voc was checked at 25 °C, so the string overvolts the controller on the first cold morning.
- The reservoir sits below one corner of the command area, which then never gets water.
Frequently asked questions
What is the rule of thumb for sizing a solar water pump?
Pump kilowatts is roughly 0.0045 times flow in cubic metres per hour times head in metres. Then the array in kilowatt-peak is roughly 1.3 times the pump rating. Both are good enough for a first estimate and not good enough to buy from.
How much does a solar water pump cost in Nepal?
For the pump alone, roughly NPR 2.4 to 3.3 lakh for 7.5 HP, NPR 4.4 to 6.0 lakh for 15 HP, and NPR 7.1 to 9.7 lakh for 30 HP. A complete electromechanical package with array, controller and protection for a mid-sized hill scheme lands somewhere between NPR 13 and 19 lakh, with civil works on top.
How much does solar PV cost per watt in Nepal?
Around NPR 20 to 30 per watt-peak for the panels, and roughly NPR 40 to 60 per watt-peak for a complete installed array on a small system, once structure, cabling, protection and installation are included.
How much area does a 1 kW solar array need?
About 5 m² of module surface. Allowing for row spacing, a ground mounted array needs 10 to 12 m² per kWp on flat land and 15 to 20 m² per kWp on hill terraces where structures split across levels. Add a metre or two all round for fencing.
How much water does one hectare need per day?
About 52 m³ per day for year round vegetables at a design rate of 0.6 litres per second per hectare. Paddy needs about 75 m³ per day across its base period. Maize and wheat need roughly 30 to 35.
How many peak sun hours should I use for Nepal?
Four, for an off grid fixed tilt system that must work through winter. The 4.6 hour figure often quoted is the annual average and will make your Poush and Magh output look better than it will be.
What size solar pump do I need for one hectare?
It depends far more on head than on area. At 40 metres head a hectare of vegetables needs roughly 3 kW. At 125 metres the same area needs around three times that. Measure your head before anyone quotes you a pump.
Do solar water pumps need batteries?
No. A standard system runs in daylight and stores water in a tank instead of electricity. A tank costs less, lasts longer and never needs replacing at year seven.
What do I do when the source cannot meet the demand?
Choose openly between three options: irrigate less land properly, rotate zones and accept a deficit, or add a supplementary source. Rotation is the most popular and the most misunderstood. It moves water between days; it does not make more.
Which software do I actually need to start?
Google Earth Pro, the Global Solar Atlas, a friction calculator, a pump selector and a spreadsheet will carry you through a complete design. PVsyst, AutoCAD and HOMER are worth learning and none of them is needed to size your first scheme correctly.
Where to go next
Work the thirteen steps in order and write down every term as you go. Three numbers will decide whether your design survives contact with the site: the dry season source yield, the surveyed vertical head, and the duty point efficiency of the pump you actually buy. All three are measured, not assumed, and that is the whole difference between a design and a guess.
This kind of sizing work usually sits inside a broader solar PV feasibility study — the same site assessment and financial framing, applied to a pump instead of a rooftop array.